Jerome is an accomplished Chartered Financial Planner. In order to stand out from the other CFPs in the marketplace, he is going to upend his consulting services by leveraging on dashboards as a communication tool. He wants to share with his prospective clients critical KPIs as well as identify any gaps in their retirement funding plans.
He wants his Dashboard to have the following KPIs and options:-
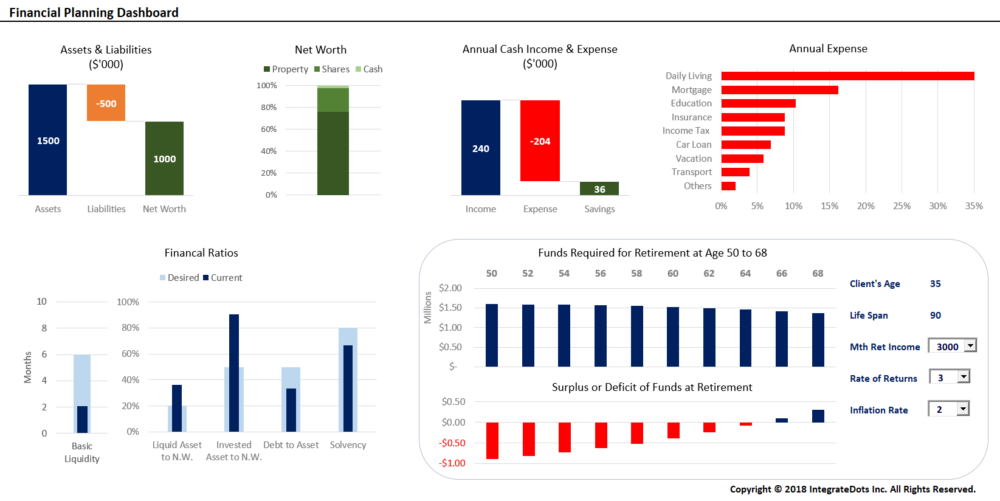
- snapshot of the client’s current assets, liabilities and net worth
- composition of net worth
- annual income vs expenses
- breakdown of annual expenses
- key financial ratios e.g. basic liquidity, solvency, debt to asset … etc
- funds required for retirement at age 50 to 68
- surplus or deficit of funds at retirement
- option to choose monthly retirement income
- option to choose the inflation rate
- option to choose the rate of returns
- funding computations must account for all present and future values
Using some cool techniques coupled with a dose of creativity, this snazzy Dashboard can be built entirely with Excel.
Here’s the shocker – this dynamic and interactive Dashboard has been built without having to write a single line of VBA code. Yup, you heard it right! Anyone, including a non-techie, can learn to build awesome Dashboards!
If you’d like to learn how to build cool Dashboards using Excel, please consider signing up for our Building Impactful Dashboards workshop.
If you are an NTU Alumnus, you can enjoy a hefty 30% discount! Look out for the coupon code on the NTU Alumni facebook.
Besides the Dashboard workshop, we also conduct Coding in VBA and Coding in Python workshops. Coding is no longer a nice skill to have. It is a MUST HAVE skill in the 21st Century Economy. Get equipped now!
We also conduct FREE 1-hour onsite demo to showcase some of our Excel Dashboards and VBA Automation. Request online now!