Matplotlib is another simple and popular module used in Python programs. By importing the rich Matplotlib (https://matplotlib.org) library module, you will be able to produce quality customized plots easily.
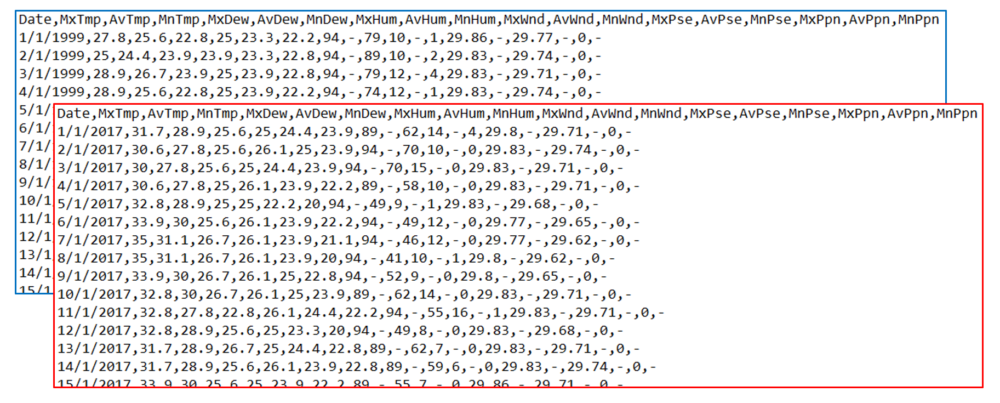
In this case study, we examine if there is an uptick in the daily temperatures in Singapore over the years. We compare the daily maximum temperature recorded in Singapore between 1999 (the earliest complete data available) and 2017. The two CSV files sgWeather2017 and sgWeather1999 contain daily maximum, average and minimum of six weather related data* – temperature, dew point, humidity, wind speed, pressure and precipitation.
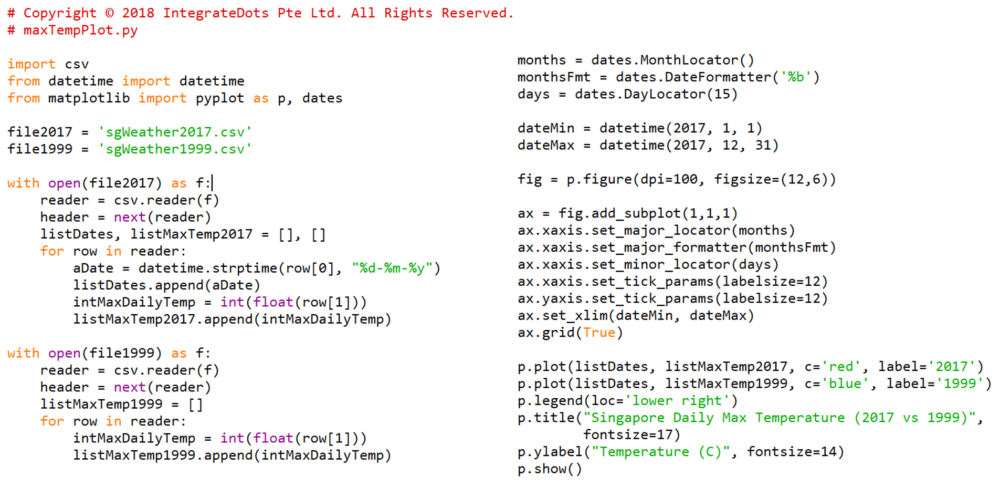
We wrote a simple Python program to parse the two CSV files and plot time-series line charts for the daily maximum temperatures recorded in 2017 and 1999.
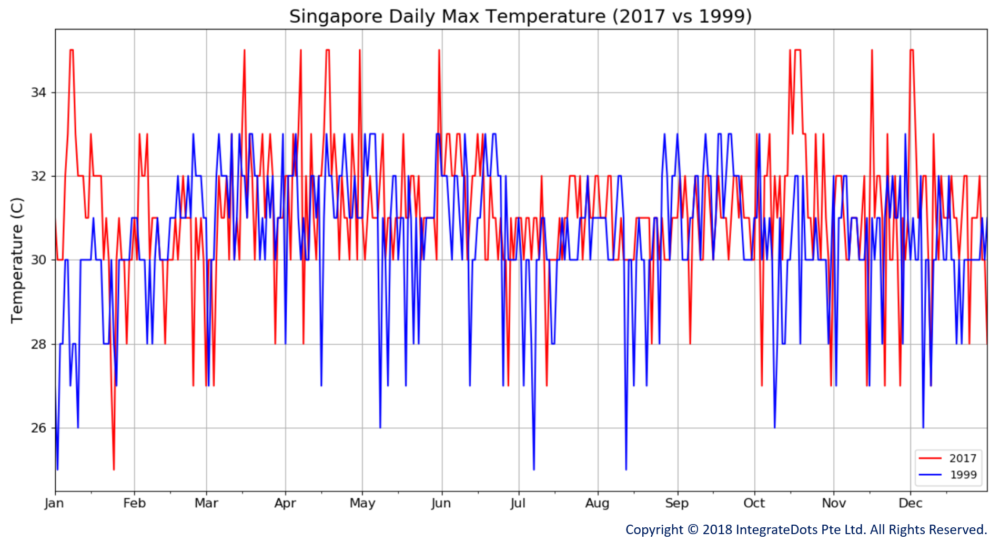
The two plots below paint a sobering picture. Over a 19-year period, Singapore’s daily temperatures have been creeping upwards. Back in 1999, the maximum daily temperature recorded never exceeded 33 degree Celsius. In 2017, there were many days when the maximum daily temperatures hit 35 degree Celsius or higher! There were more cooler days too in 1999 where maximum daily temperatures were 28 degree Celsius or below!
* The data was originally downloaded from www.wunderground.com