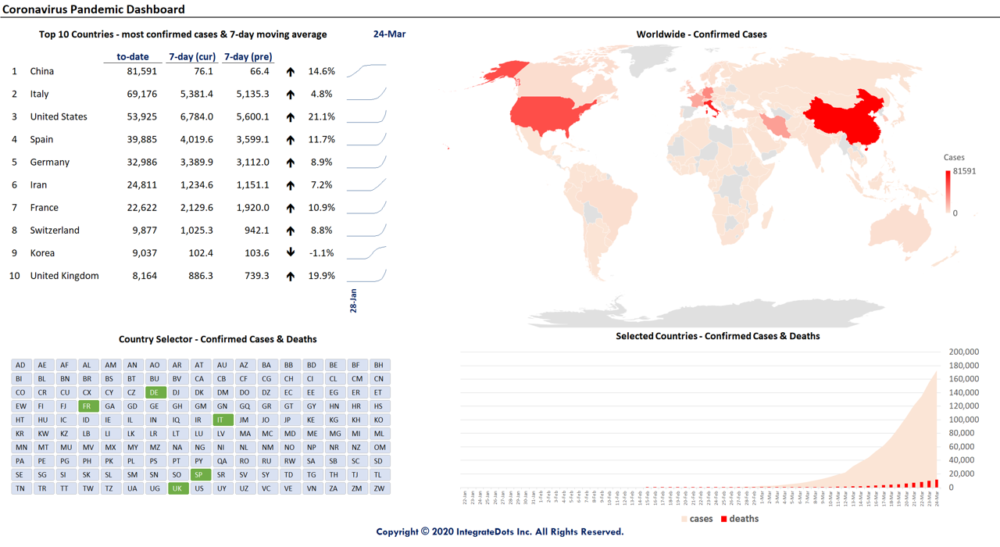
Jessie is a bright intern at B*Stars, a company specializing in virus test kits and vaccines. In collaboration with renowned research institutions, the company is working in overdrive to search for a cure to combat the Coronavirus pandemic. To date, confirmed cases of the Coronavirus have been reported in 170 countries!
Jessie has been tasked by her supervisor to build an automatic and interactive Dashboard to track the Coronavirus pandemic. The Dashboard needs to have the following KPIs and options:-
- top 10 countries with most confirmed cases to-date
- 7-Day-Moving Average of new confirmed cases
- comparison between current and previous 7DMAs
- choropleth world map to show the distribution of confirmed cases
- option to select countries to see trending of confirmed cases
- option to select countries to see trending of deaths
Using some cool techniques coupled with a dose of creativity, this snazzy Dashboard can be built entirely with Excel.

Here’s the shocker – this automated and interactive Dashboard has been built without having to write a single line of VBA code. Yup, you heard it right! Anyone, including a non-techie, can learn to build awesome Dashboards!
If you’d like to learn how to build cool Dashboards using Excel, please consider signing up for our Excel Dashboards workshop.
If you are an NTU Alumnus, you can enjoy a hefty 30% discount! Look out for the coupon code on the NTU Alumni facebook.
Besides the Dashboard workshop, we also conduct Coding in VBA, Coding in Python and Machine Learning workshops. Coding is no longer a nice skill to have. It is a MUST HAVE skill in the 21st Century Economy. Get equipped now!
We also conduct FREE 1-hour onsite demo to showcase some of our Excel Dashboards and VBA Automation. Request online now!
