Jamie is the Human Resource Director at AirBike, an innovative company that designs and builds super fast bikes that can zip through congested city roads!
AirBike headquarters in Singapore with R&D facilities in Israel and Japan, and manufacturing in China. It also has sales & services offices in South East Asia and Middle East.
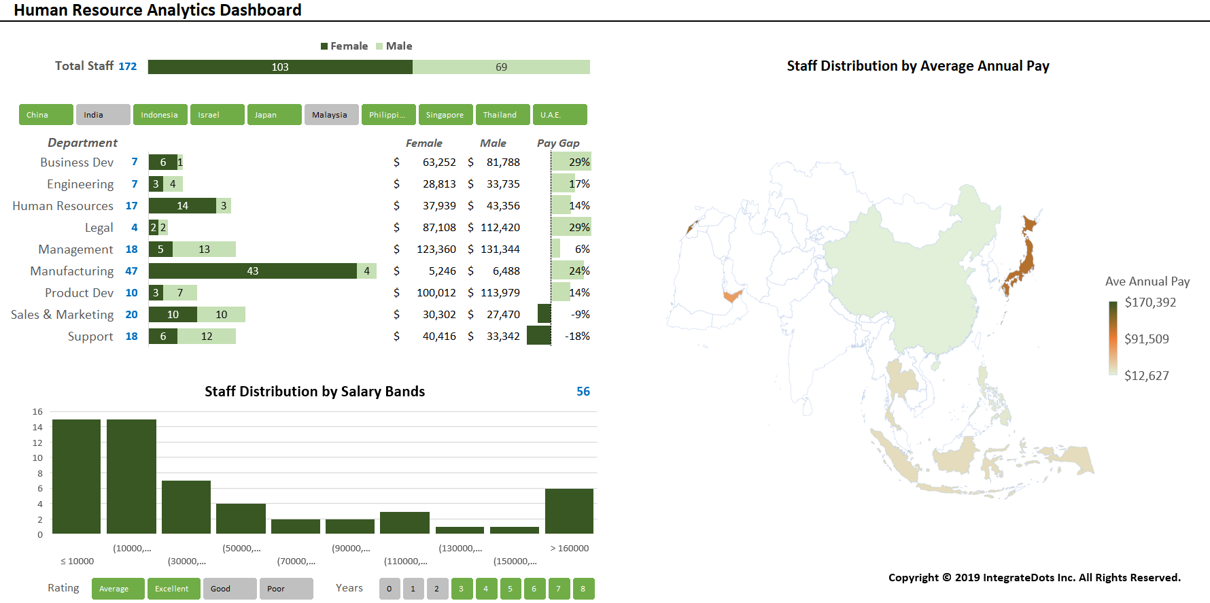
For the upcoming Senior Exec Annual Review, Jamie needs to give an overview on HR. She wants to use an interactive Dashboard to dazzle the audience. The Dashboard needs to show the following KPIs:-
- a choropleth map to show staff salary distribution across the different regions
- headcount distribution by gender and department
- gender pay gap by the department
- option to slice and dice the information by country
- option to slice and dice the information by staff performance rating
- option to slice and dice the information by staff length of service
Using some cool techniques coupled with a dose of creativity, this snazzy Dashboard can be built entirely with Excel.
Here’s the shocker – this dynamic and interactive Dashboard has been built without having to write a single line of VBA code. Yup, you heard it right! Anyone, including a non-techie, can learn to build awesome Dashboards!
If you’d like to learn how to build cool Dashboards using Excel, please consider signing up for our Building Impactful Dashboards workshop.
If you are an NTU Alumnus, you can enjoy a hefty 30% discount! Look out for the coupon code on the NTU Alumni facebook.
Besides the Dashboard workshop, we also conduct Coding in VBA and Coding in Python workshops. Coding is no longer a nice skill to have. It is a MUST HAVE skill in the 21st Century Economy. Get equipped now!
We also conduct FREE 1-hour onsite demo to showcase some of our Excel Dashboards and VBA Automation. Request online now!