About This Event
This 6-hour instructor-led workshop is the answer for busy executives and working professionals who have always wanted to communicate more effectively using Dashboards. How to design and build automated snazzy Dashboards that conveys exactly the story you wanted to be told? Join hundreds of professionals across all industries (banking, oil and gas, engineering, info tech, medical, legal, education, …) who have benefitted from our workshops. Be amazed that you can easily build an interactive and dynamic Dashboard with absolutely no coding!
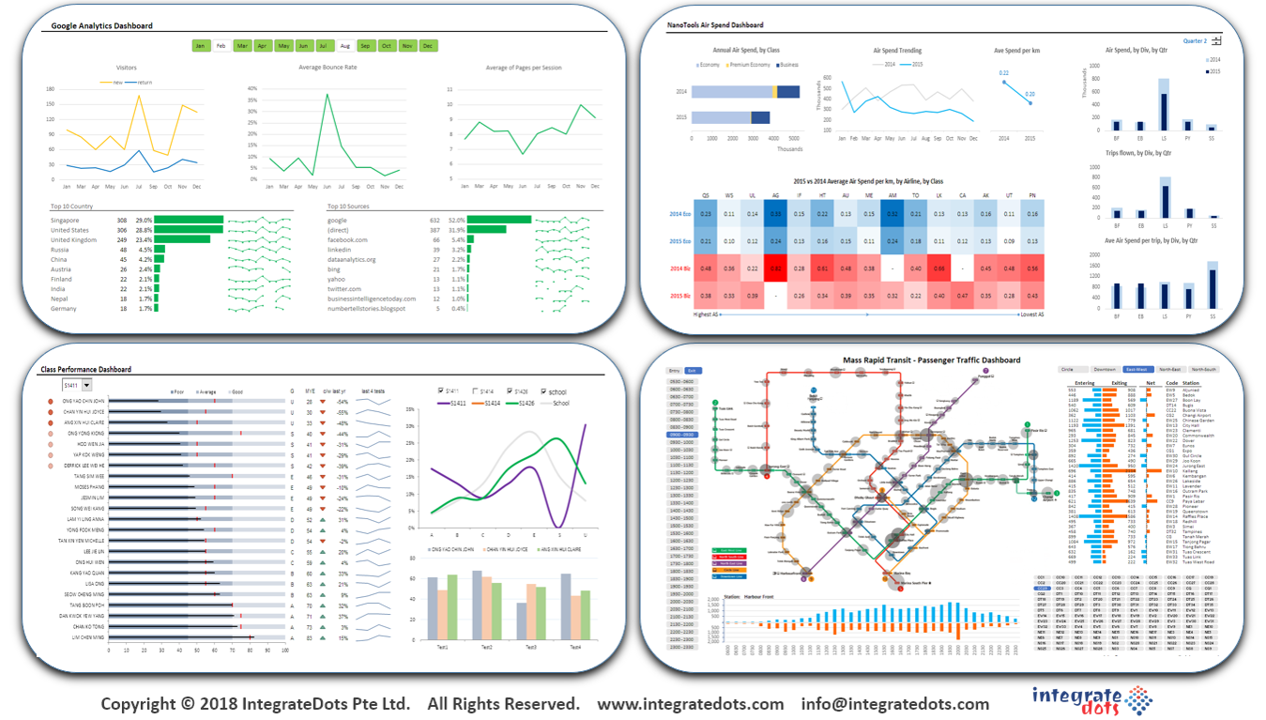
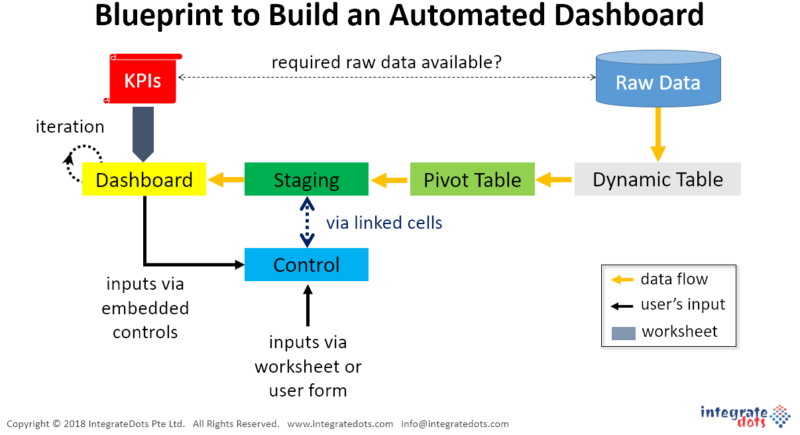
Participants will learn essential skills, tips and techniques to design and build effective Dashboards using just Microsoft Excel. There is no need to buy expensive tools to build a great Dashboard. The workshop emphasizes building robust and automated Dashboards in a systematic manner (see blueprint below).
There will be plenty of hands-on exercises to help participants learn and apply the key Excel building blocks (e.g. decision making, pivot & dynamic tables, heat mapping, slicers, … etc) that are particularly useful for building effective Dashboards. Learn how to construct non-native Excel graphical elements such as the bullet and thermometer graphs. Is it possible to control access to different parts of your Dashboard project? Yes! Get the answer from the workshop.
More details and scope of this workshop can be found here.
Our past participants’ feedback on this workshop can be found here.
IMPORTANT NOTE:
Participants must bring along their own laptops or macs installed with running copy of Microsoft Excel 2007 or later version. All hands-on coding exercises will be done on the participants’ laptops or macs. No laptops or macs will be provided.
Date/Time
Date(s) - 23/06/2018
9:00 am - 4:00 pm
Location
NTU Alumni House @ Marina Square
Categories
Bookings
Bookings are closed for this event.